Favicon of ChartPixel

ChartPixel

Introducing ChartPixel - Your Data Visualization Partner ๐ŸŒŸ Instant Visualization: ChartPixel automatically transforms your raw data into a variety of explained charts and summary insights, enhancing data comprehension instantly. ๐Ÿค– Smart Data Analysis: Let AI handle the data complexities. ChartPixel auto-selects relevant columns, tidies up messy data, and suggests meaningful features for comprehensive data interpretation. ๐Ÿ“Š From Raw Data to Presentation: Seamlessly convert your data insights into visually impressive and statistically accurate PowerPoint presentations. Craft compelling narratives with ease. ๐ŸŒ Web Data Integration: Broaden your analysis horizons. Utilize ChartPixel's keyword search tool to find and integrate web data into your charts, enriching your data-driven stories. User Benefits: ๐Ÿš€ Effortless Visualization: No more struggling with complex data analysis tools. ChartPixel simplifies the process, making data visualization accessible to all. ๐Ÿง  Smart Insights: AI-powered data analysis ensures that you're focusing on the most relevant aspects of your data for better decision-making. ๐Ÿ’ฅ Stunning Presentations: Turn data into compelling presentations effortlessly, impressing your audience with both visuals and insights. ๐ŸŒ Web Data Integration: Expand your analysis with external data sources, providing a more comprehensive view. Summary: ChartPixel is your partner in simplifying data analysis and visualization. It empowers users of all skill levels to effortlessly create insightful charts from raw data. With AI-assisted annotations, instant visualization, and web data integration, ChartPixel revolutionizes the way you work with data, making it both accessible and actionable. Say hello to a new era of data-driven decision-making with ChartPixel.

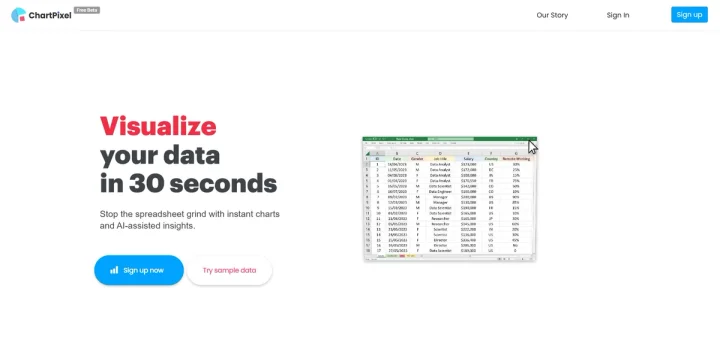
Screenshot of ChartPixel website

Introducing ChartPixel - Your Data Visualization Partner. With AI-assisted annotations and instant visualization, it simplifies data analysis and presentation creation for users of all skill levels. Key Features and Highlights: Instant Visualization: Say goodbye to manual chart creation. ChartPixel automatically transforms your raw data into a variety of explained charts and summary insights. It enhances data comprehension instantly. Smart Data Analysis: Let AI handle the data complexities. ChartPixel auto-selects relevant columns, tidies up messy data, and suggests meaningful features for comprehensive data interpretation. From Raw Data to Presentation: Seamlessly convert your data insights into visually impressive and statistically accurate PowerPoint presentations. Craft compelling narratives with ease. Web Data Integration: Broaden your analysis horizons. Utilize ChartPixel's keyword search tool to find and integrate web data into your charts, enriching your data-driven stories. User Benefits: Effortless Visualization: No more struggling with complex data analysis tools. ChartPixel simplifies the process, making data visualization accessible to all. Smart Insights: AI-powered data analysis ensures that you're focusing on the most relevant aspects of your data for better decision-making. Stunning Presentations: Turn data into compelling presentations effortlessly, impressing your audience with both visuals and insights. Web Data Integration: Expand your analysis with external data sources, providing a more comprehensive view. Summary: ChartPixel is your partner in simplifying data analysis and visualization. It empowers users of all skill levels to effortlessly create insightful charts from raw data. With AI-assisted annotations, instant visualization, and web data integration, ChartPixel revolutionizes the way you work with data, making it both accessible and actionable. Say hello to a new era of data-driven decision-making with ChartPixel.

Categories:

Share:

Ad
Favicon

ย 

ย ย 
ย 

Similar to ChartPixel

Favicon

ย 

ย ย 
ย ย 
Favicon

ย 

ย ย 
ย ย 
Favicon

ย 

ย ย 
ย ย